Histograms are a powerful tool for visualizing data, and are commonly used in fields such as statistics, data analysis, and machine learning.
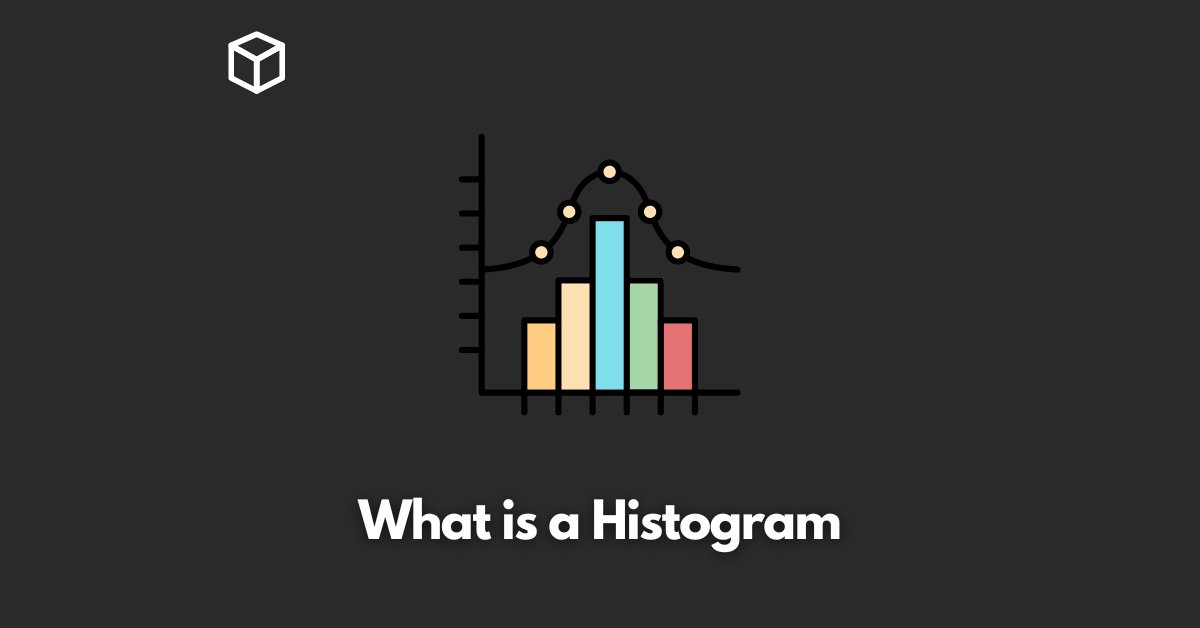
A histogram is a graphical representation of the distribution of a dataset.
It is a way to visualize the frequency of different values within a dataset.
In a histogram, the x-axis represents the range of values within the dataset, and the y-axis represents the frequency of those values.
Histograms are particularly useful for understanding the distribution of numerical data, and can be used to identify patterns and outliers in the data.
In this article, we will explore what histograms are, how to create and read them, and some common mistakes to avoid.
By the end of this post, you will have a solid understanding of how to use histograms to better understand your data.
Creating a Histogram
Creating a histogram is a straightforward process, and can be done using a spreadsheet program or statistical software.
First, you will need to organize your data into bins, which are the ranges of values that will be represented on the x-axis of the histogram.
The number of bins you choose will depend on the amount of data you have, and the level of detail you want to see in the histogram.
As a general rule, you should aim for around 5-10 bins for small datasets, and around 20-30 bins for larger datasets.
Once your data is organized into bins, you can create the histogram by plotting the frequency of each bin on the y-axis.
Most spreadsheet programs and statistical software will have built-in histogram tools that will make this process even easier.
Reading a Histogram
Once you have created your histogram, it is important to know how to interpret it.
The x-axis of the histogram represents the range of values within the dataset, while the y-axis represents the frequency of those values.
The shape of the histogram can tell you a lot about the distribution of the data, and can help you identify patterns and outliers.
For example, a histogram with a bell-shaped curve is likely to be a normal distribution, while a histogram with a long tail on one side is likely to be a skewed distribution.
Additionally, outliers can often be identified as data points that fall outside of the general pattern of the histogram.
Types of histograms
There are two main types of histograms: frequency histograms and density histograms.
A frequency histogram represents the number of data points that fall within a certain range of values, while a density histogram represents the proportion of data points that fall within a certain range of values.
Frequency histograms are generally used when working with large datasets, as they provide a clear picture of the overall distribution of the data.
Density histograms, on the other hand, are generally used when working with smaller datasets, as they provide a more detailed picture of the distribution of the data.
Common mistakes to avoid
When working with histograms, there are a few common mistakes that people often make. One of the most common mistakes is choosing the wrong bin size.
As mentioned earlier, the number of bins you choose will depend on the amount of data you have, and the level of detail you want to see in the histogram.
Choosing too few bins will result in a histogram that is difficult to interpret, while choosing too many bins will result in a histogram that is too detailed.
Another common mistake is interpreting the histogram without considering the underlying data.
It is important to remember that a histogram is only a visual representation of the data, and should be used in conjunction with other forms of analysis.
Additionally, interpreting the shape of the histogram without considering the context of the data can also lead to inaccurate conclusions.
Another common mistake is not labeling the axes of the histogram correctly. This can lead to confusion and misinterpretation of the data.
It’s important to label the x-axis with the range of values, and the y-axis with the frequency or density of the values.
Conclusion
In conclusion, histograms are extremely powerful tool for visualizing data, and are commonly used in fields such as statistics, data analysis, and machine learning.
They can help us to understand the distribution of the data and identify patterns and outliers.
It’s important to understand how to create and read histograms, as well as the different types of histograms and the common mistakes to avoid.
With this knowledge, you can use histograms to better understand your data and make more informed decisions.
If you’re looking to learn more about histograms, there are many resources available online.
Websites like Khan Academy, Coursera and DataCamp offer courses and tutorials that cover the basics of histograms and data visualization.
Additionally, many statistical software packages also have built-in tutorials and help resources that can assist you in creating and interpreting histograms.